
The roller coaster ride of total returns on the S&P 500! (Updated to October 2025)
- November 17, 2025
The roller coaster ride of total returns on the S&P 500! 🎢📈 (Updated to October 2025)
Imagine investing $10,000 in the S&P 500 (with dividends reinvested and adjusted for inflation). How much would you have today depending on when you started?
Last 5 years: +73.84% → $17,384 (actual annualized return: 11.11%)
Last 10 years: +203.65% → $30,365 (11.16% annualized)
Last 15 years: +449.02% → $54,902 (11.41% annualized) ← the best horizon right now!
Last 20 years: +432.45% → $53,245 (8.39% annualized)
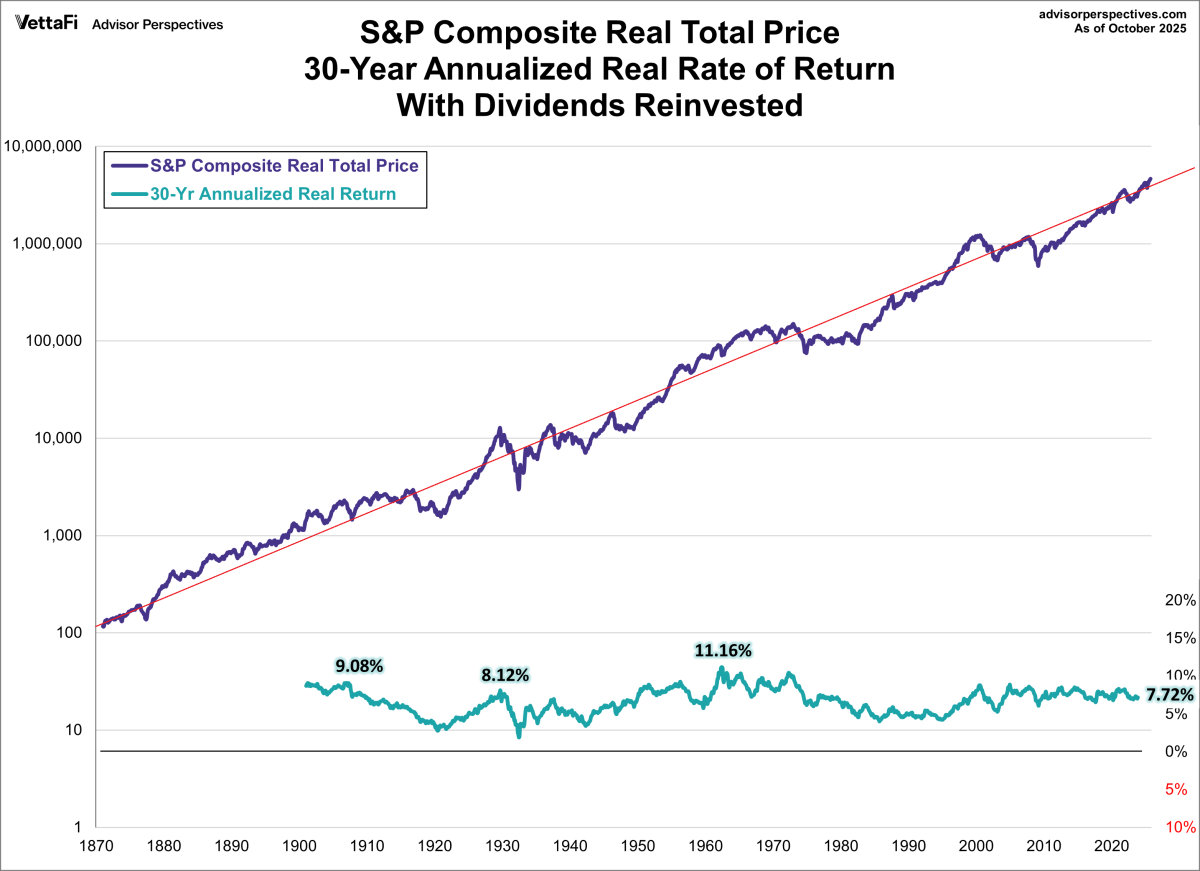
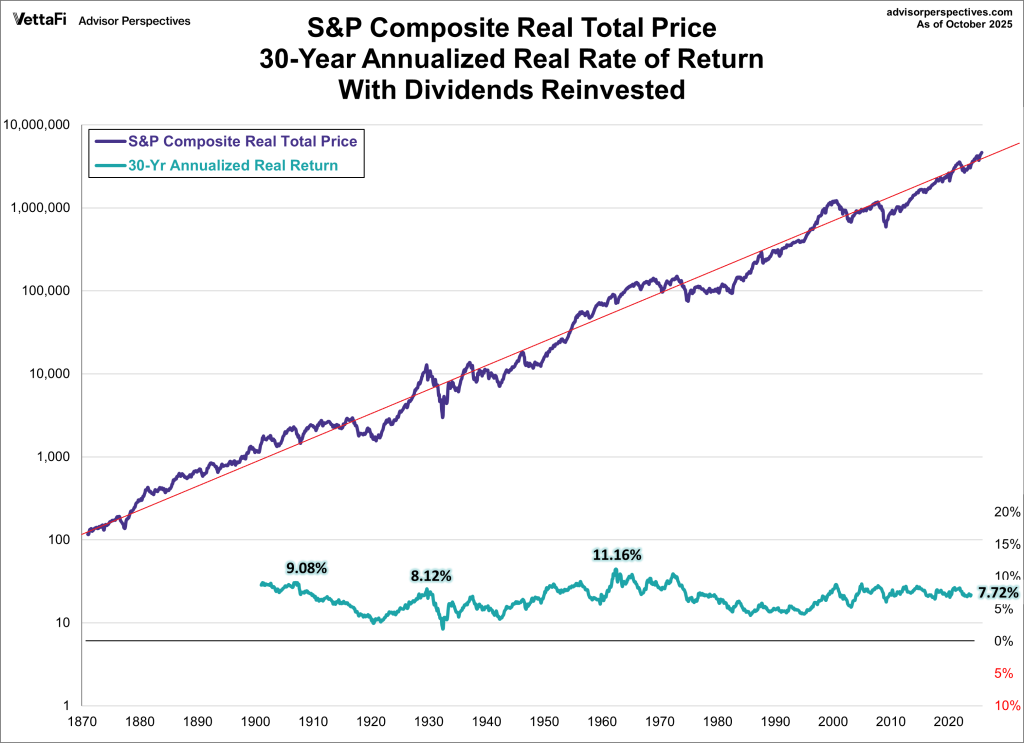
Last 30 years: +906.19% → $100,619 (7.72% annualized)
The longer the term, the less crazy the ups and downs are… but beware: if we had asked this same question in March 2009 (the bottom of the financial crisis), those same 5 years would have left you with only $6,654 in real purchasing power (-8.12% annualized). You would lose a third of the real value!
Moral of the story:
Stocks are a brutal roller coaster in the short term, but historically (since 1900) real annualized returns have ranged from <2% to >11% depending on the period chosen.
The closer you are to retirement, the less tolerance you have for these declines. Diversification is not optional, it is mandatory. 💡
Original source (including spectacular charts):
https://www.advisorperspectives.com/dshort/updates/2025/11/04/the-total-return-roller-coaster-october-2025
Related posts:
 Real total SP500 in the very long term, updated 2023
 The evolution of the stock market in the long term, and inflation
Comparing 20 years of stocks, oil, pension plans, housing and gold
Austrian business cycle theory
The destruction of money and the crisis
Simiocracy, from Aleix Salo
The evolution of the stock market in the long term, and inflation
Comparing 20 years of stocks, oil, pension plans, housing and gold
Austrian business cycle theory
The destruction of money and the crisis
Simiocracy, from Aleix Salo
 Elliott waves
 The Warren Buffet portfolio