

The basic pattern: three zigzags, with the third one being the shortest, representing the main trends (Waves 1, 2, 3, 4, 5), as shown in the following diagrams:
 o
o  o
o

Two zigzags for corrections (Waves A, B, C), of the following type:
Obviously, corrections will always be smaller in magnitude than the main trends (whether upward or downward).
Let’s look at an example of upward trends and downward corrections (though the same applies to downward trends with upward corrections):
Next, let’s look at more basic trends, which are slight variations of the ones we just saw:


And more basic corrections:


Furthermore, according to some authors, Elliott’s theory has three main rules that must be followed to guide us in understanding stock market movements and that can be very useful for recognizing patterns:
-
The second wave cannot fall below the first wave.
-
The third wave cannot be the shortest of the impulse waves.
-
The fourth wave must not overlap with the first wave.
Additionally, retracements within waves usually correspond to Fibonacci retracement levels, primarily 38.2% and 61.8%.
Channeling
An important tool for projecting targets in the next wave. It involves drawing parallel or angled lines that define the channel of the trend or correction. Let’s look at some examples:


[Via: http://www.relatividad.org/ondas_elliott/]
Related posts:
 The evolution of the stock market in the long term, and inflation
Austrian business cycle theory
Comparing 20 years of stocks, oil, pension plans, housing and gold
The evolution of the stock market in the long term, and inflation
Austrian business cycle theory
Comparing 20 years of stocks, oil, pension plans, housing and gold
 Expropiation of Repsol, what Argentina seeks
 The Warren Buffet portfolio
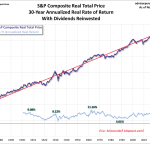 Real total SP500 in the very long term, updated 2023
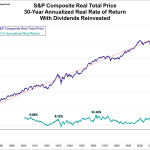 The roller coaster ride of total returns on the S&P 500! (Updated to October 2025)
The destruction of money and the crisis
The roller coaster ride of total returns on the S&P 500! (Updated to October 2025)
The destruction of money and the crisis