

Back in 2010, 2012, 2017, and 2022, I posted some charts here of the “real” S&P 500, i.e., adjusted for inflation, in a semi-logarithmic chart, covering a very long term (since 1870).
I update the chart as usual with a trend line, chart from advisorperspectives.cm
Back in 2010, 2012, and 2017, I posted some charts here of the “real” S&P 500, i.e., adjusted for inflation, in a semi-logarithmic chart, covering a very long term (since 1870).
I update the chart as usual with a trend line, chart from dshort.com
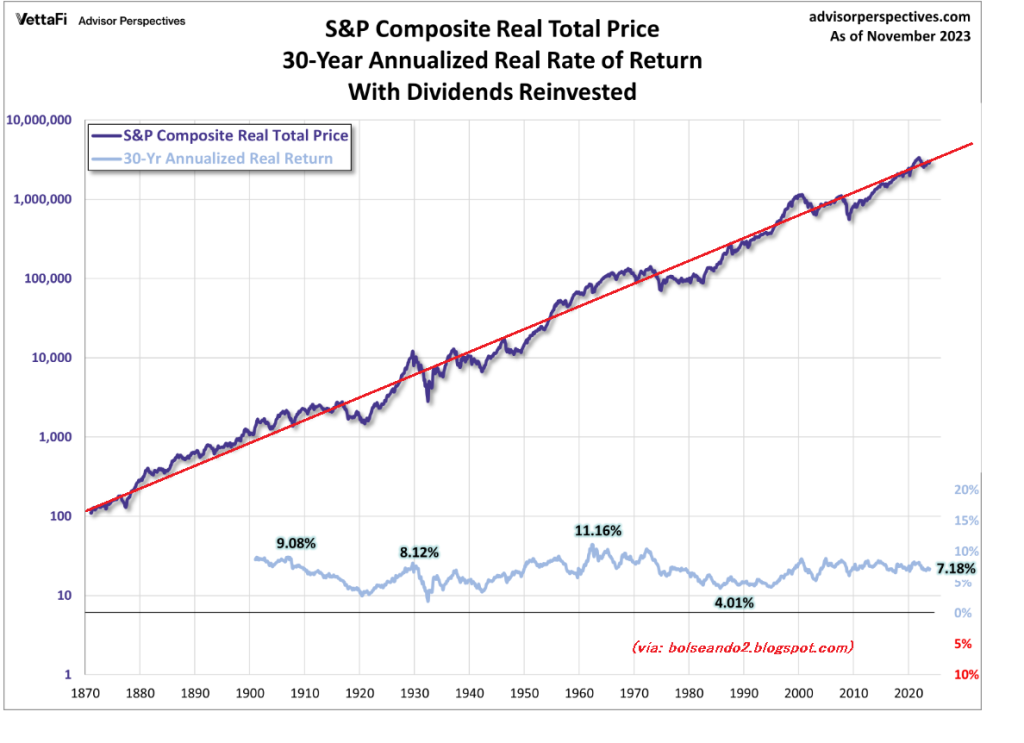
In 2010 and 2012, we predicted that the SP500 would approach the trend line, and so it did, passing above it. However, with the inflation crisis and the war in Ukraine in 2022, it suffered a sharp decline and fell back below the line. From this point on, we anticipated uncertainty due to fears of recession, but the odds remained bullish and, as we predicted, the SP500 “real total return” has returned to the regression line.
This trend line implies an approximate annual gain of 7%, so we can estimate that annual gain for the coming years, and therefore we expect the real total SP500 to follow this trend, albeit with probable fluctuations of more than 10% up and down. Thus, the pure SP500 could quite likely rise by 7% plus inflation and minus dividends during 2024, which could leave it at around 7% as well, although always with great uncertainty due to the volatility of the index’s typical fluctuations. The 7% is the average outlook over a 30-year period.
This gain is, as we said, with dividends reinvested and inflation discounted.
Related posts:
 The evolution of the stock market in the long term, and inflation
 The roller coaster ride of total returns on the S&P 500! (Updated to October 2025)
Comparing 20 years of stocks, oil, pension plans, housing and gold
ESPAÑISTAN, real estate bubble and Spanish crisis
The roller coaster ride of total returns on the S&P 500! (Updated to October 2025)
Comparing 20 years of stocks, oil, pension plans, housing and gold
ESPAÑISTAN, real estate bubble and Spanish crisis
 Expropiation of Repsol, what Argentina seeks
 The Warren Buffet portfolio
 Elliott waves
Simiocracy, from Aleix Salo
Elliott waves
Simiocracy, from Aleix Salo